Showing posts with label node. Show all posts

Saturday, 2 April 2022

The Org Documentor Keeps On Executing


Introduction

Back in February I added support for some of the steps of the order of execution, mostly because of the flow ordering support added in Spring 22. This has created a nice backlog of work to support more of the steps, starting with duplicate rules which I added in today. 

Duplicate Rules

This is a slight departure from earlier releases of the documentor, in that I haven't added processing of duplicate rules to generate a dedicated page, I've just added them to the order of execution page. If you think they need their own page, or more likely their own section in the object detail pages, please raise a request in the Github repository and I'll see what I can do.


The order of execution page lists the active duplicate rules and the matching rules that they depend on. I'm undecided as to whether any more information is needed, but again if you think there is, please feel free to raise an issue in the repo.


As always, you can see an updated example of the order of execution, and the other pages, generated from the sample metadata at the Heroku site.

Updated Plug-in


Version 4.0.5 of the plug-in has this new functionality and can be found on NPM

If you already have the plug-in installed, just run sfdx plugins:update to upgrade to 4.0.5 - run sfdx plugins once you have done that to check the version.

The source code for the plug-in can be found in the Github repository.

Columbo Close


Just one more thing, not related to the Documentor itself but the Google site that I use to document it. This now has it's own custom domain - orgdoc.bobbuzzard.org. With a small amount of DNS changes to apply the custom domain to the site, Google provides the SSL certificate for me, which is nice.

Related Posts


Sunday, 27 February 2022

Org Documentor - (Some of) The Order of Execution

Introduction

It's been a while since I made any changes to the Org Documentor, partly because I've been focused in other areas, and partly because I didn't need anything else documented. This changed with the Spring 22 release of Salesforce and the Flow Trigger Explorer

I really liked the idea of the explorer, but was disappointed that it showed inactive flows and didn't reflect the new ordering capabilities. Why didn't they add that, I wondered. How hard could it be? Then it occurred to me that I could handle this myself through the Org Documentor. It turns out I couldn't handle all aspects, but still enough to be useful. More on that later.

Flow Support

Up until now I hadn't got around to including flows in the generated documentation, and this clearly needed to change if I wanted to output the order they were executed in. 

As long as API version 54 is used, the execution order information comes back as expected, and getting these in the right order and handling collisions based on names is straightforward with a custom comparator function. Sadly I can't figure out the order when there is no execution information defined, as CreatedDate isn't available in the metadata. Two out of three ain't bad.

Order of Execution

As there are multiple steps in the order of execution, and most of those steps require different metadata, I couldn't handle it like I do other metadata. Simply processing the contents of a directory might help for one or two steps, but I wanted the consolidated view. To deal with this I create an order of execution data structure for each object that appears in the metadata, and gradually flesh this out as I process the various other types of metadata. So the objects add the validation rule information, triggers populate the before and after steps, as do flows. 

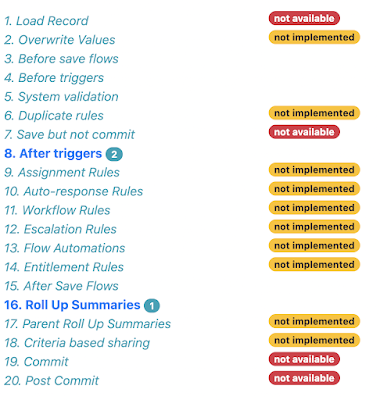
As everyone knows, there's a lot of steps in the order of execution, and I'm not attempting to support all of them right now. Especially as some of them (write to database but don't commit) don't have anything that metadata influences! Rather than trying to detail this in a blog post that I'd have to update every time I change anything, the order of execution page contains all the steps and adds badges to show which are possible to support, and which are supported:


As you can see, at the time of writing it's triggers and flows plus validation rules and roll up summaries. 

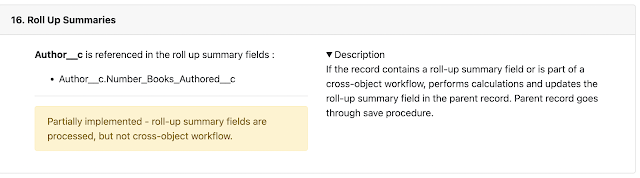
Steps where there is metadata that influences the behaviour appear in bold with a badge to indicate how many items there are. Clicking on the step takes you to the section that details the metadata:


You can see an example of the order of execution generated from the sample metadata at the Heroku site.

Updated Plug-in


Version 4.0.1 of the plug-in has this new functionality and can be found on NPM

If you already have the plug-in installed, just run sfdx plugins:update to upgrade to 4.0.1 - run sfdx plugins once you have done that to check the version.

The source code for the plug-in can be found in the Github repository.

Related Posts


Sunday, 1 November 2020

Giving the CLI Scanner the GUI Treatment

Introduction

As I've written about in recent posts, I'm using the Salesforce CLI Scanner to perform static code analysis on a number of my projects. As it's clearly part of my day to day use of the Salesforce CLI, I decided to add it to my CLI GUI.  

TL;DR, pull the latest code from the Github repository, or clone it and follow the instructions to carry out the initial setup. When it starts up you'll have the Scanner command group.

Commands

I added the scanner as a new command group, with a couple of commands - listing the rules and running the scanner.

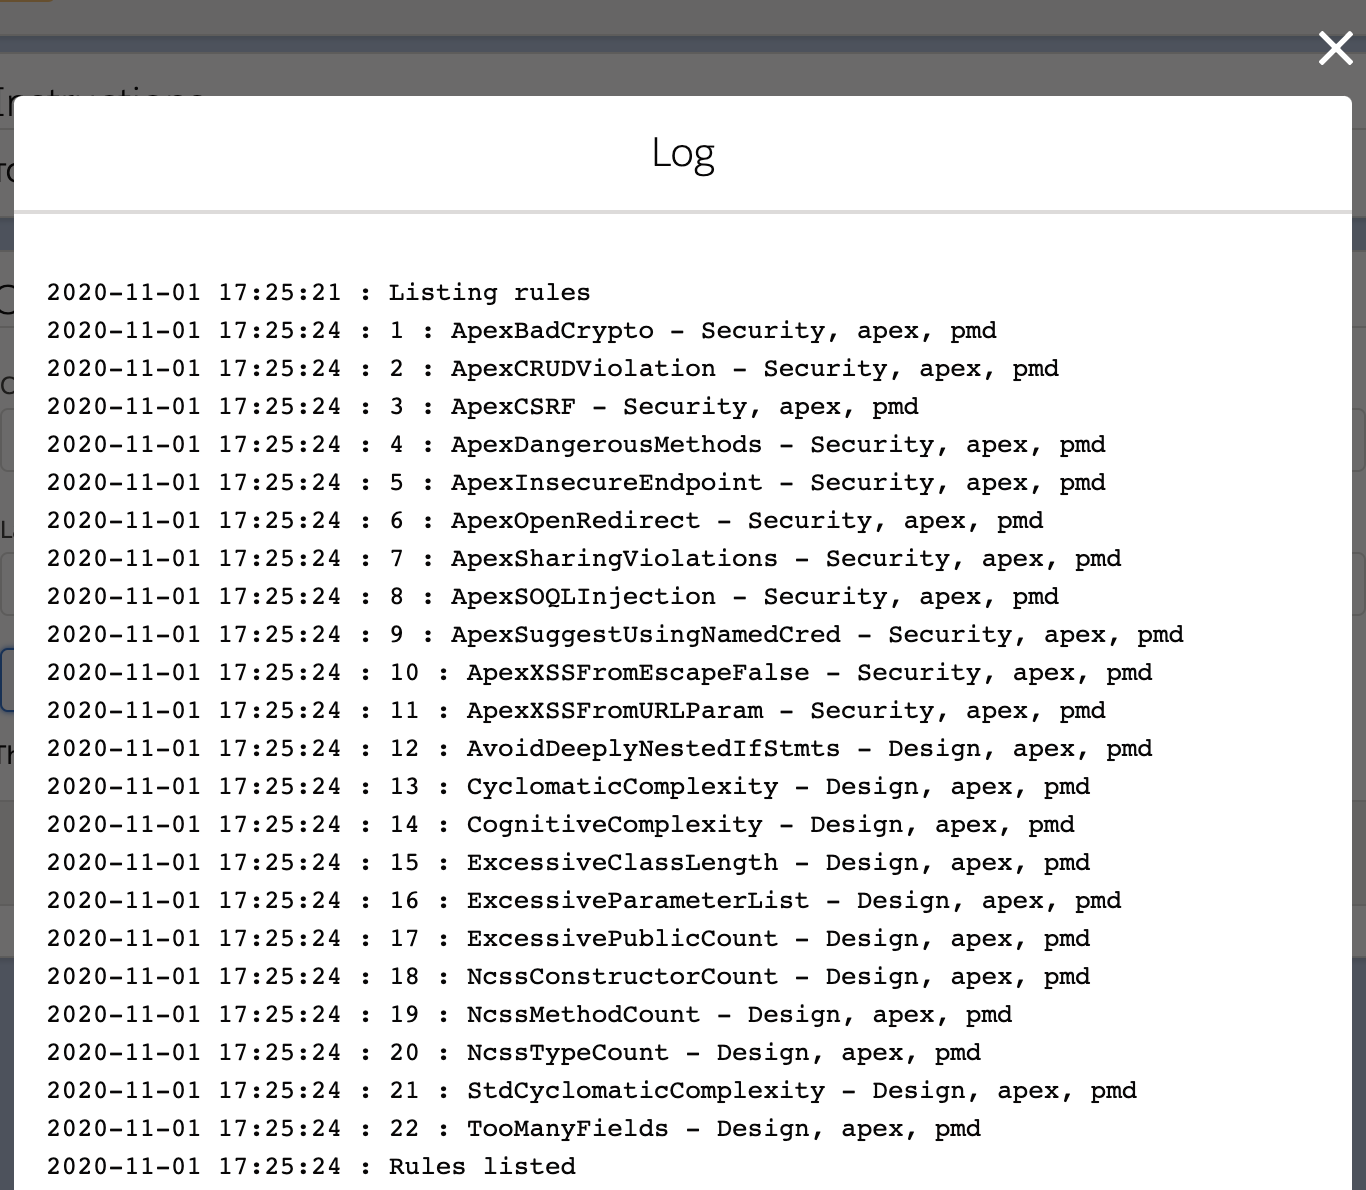
Listing Rules

Listing the rules is fairly straightforward as I used existing parameter types to capture the categories and language, should the user wish to provide them:


and only needed to include a function to process the return JSON to extract the rule details and dump them to the log panel:


Running the Scanner


Running the scanner was a little more complex. First, I usually want to pick the categories but I don't want to have to remember the exact names, so I needed a mechanism to allow me to select from list of options. I've got a good start for this around allowing the user to choose which log file to retrieve from the Debugging command group. Under the hood I run the scanner:rule:list command, process the output to extract the unique category names, then build a select element using the categories as options. As I can choose multiple options I set the multiple attribute and give it a size of 7.  I don't always want to choose though, so I didn't want to have to wait every time for the command to run, so I gave myself a button to click:


I also typically want to open the file that the output is sent to, so I added this capability too:


Aside from this, most of my effort went into figuring out how to pass enquoted parameters to the scanner:run command (to define the targets, for example) on MacOS and Windows 10. I learned, for example, that Node's execFileSync will not spawn a shell to run the command thus any spaces I provide will be assumed to be different arguments to be passed to the command, regardless of any quotes that I might add in a futile attempt to influence it. execSync, on the other hand, will spawn a shell which will know that an enquoted string is a single parameter, allowing the command to succeed. I wouldn't be surprised if there is still the odd issue around this in there, so if you find one let me know by raising an issue at the Github repo.


Saturday, 15 August 2020

Org Documentor and AuraEnabled Classes


Introduction

In the Winter 21 release of Salesforce, access to AuraEnabled methods in Apex classes will be restricted to users with profiles or permission sets that grant access to those classes. If you've been working in a sandbox recently you've probably encountered this already, as the critical update for this was enabled on August 8th.

Figuring out who (if anyone) has access to classes isn't straightforward, as you have to trawl through the profiles and permission sets and check each one. Salesforce have created an Aura Enabled Scanner application that can be installed via an unlocked package, which checks packaged and unpackaged code, but it does require that you login to Salesforce each time you need to check things.

This seemed like a good candidate for my Org Documentor Salesforce CLI Plug-In - something that can be run on a schedule, check that any new classes used as controllers for Aura or Lightning Web Components are accessible, and show which profiles/permission sets have access.


Configuration

To add processing for AuraEnabled classes, an additional stanza is required in the configuration file passed to the bbdoc command - here's what it looks like in my example repo:

"auraenabled": {
    "name": "auraenabled",
    "description": "AuraEnabled Class Access", 
    "subdirectory": ".",
    "image": "images/auraenabled.png",
    "suffix":"object",
    "groups": {
        "other": {
            "name":"other", 
            "title":"AuraEnabled Components",
            "description": "All components with Apex controllers"
        }
    }
}

As with other metadata types, you can specify multiple groups to slice up your components into functional areas - I've lumped them all into one group as I only have one component!


Output

The index (home) page for the org report displays a new card for the AuraEnabled metadata:


An error badge is displayed if there are one or more classes used as controllers for components that aren't accessible from any profile or permission set. 

Clicking in to the details shows the groups and errors:


and clicking into the group shows the detail for each component, with classes that aren't accessible highlighted as errors:


Note that if a Lightning Web Component accesses multiple Apex classes, there will be a row for each class with the same component name in the report, as shown above.


Processing

I was quite pleased by how little code I had to write to add support for this:

  • A classes map structure is created in memory, profilesAndPermSetsByClassname, where each entry has the Apex class name as a key and a value object containing lists of permission sets and profiles with access to the class. This is generated by loading all of the profile and permission set metadata and iterating the ClassAccess sections. 

  • The component groups are iterated, and for each entry in the group:

    • If it is an Aura Component, the controller attribute from the <aura:component/> tag is extracted

    • If it is a Lighting Web Component (which can access multiple Apex classes), @salesforce/apex/ lines are identified and the Apex class name extracted. 

      For each class:

      • The entry for the class in the profilesAndPermSetsByClassname map is extracted. If this is null or both of the profile and permission set lists are empty, the classname is added to the error collection displayed on the group page.

      • A row is added to the JavaScript object backing the group page showing the profiles/permission sets that have access, adding the error highlight colour if there are none.


Plug-In

The updated bbddoc Salesforce CLI plug-in providing AuraEnabled support can be found on NPM, and the source code is available in the Github repository. 


Why not use the AuraEnabledScanner?

You absolutely should - I do, to configure access. This works with the AuraEnabledScanner rather than replacing it. As development continues, new classes and components are added to your codebase. The Org Documentor flags up any that don't have appropriate access, and you can then login to an org that your metadata is deployed to, run the scanner and fix up the access. 

The scanner also handles managed classes which the Org Documentor doesn't, as it works against your metadata on disk rather than everything installed in a specific org instance.


Related Posts

Saturday, 8 August 2020

New bbsfdx Plug-In Cleanup Commands

New bbsfdx Plug-In Cleanup Commands


Introduction


bbsfdx is my Salesforce CLI utilities plug-in. It receives infrequent updates, typically when I find myself doing the same thing repeatedly via workbench or the like. It doesn't have many functions as I try to keep it to utilities - anything new goes into it's own dedicated plug-in (e.g mentz, bbdoc, bbpdf). This week I found the need to add a couple of functions and published V1.3 of the plug-in.

New Commands

bb:devconsole:delete

When the developer console won't load, up until now I've googled for the help article and followed the instructions to remove the IDEWorkspace record for my user via the workbench. 

This happened a couple of times in the last week, so I decided I needed a quicker way. 

bb:logs:delete 

Since the Summer 19 release, we can store up to 1,000Mb of debug logs, so I don't often fill up the storage. That said, some of the areas I work in generate logs close to the 20Mb per log limit, and it doesn't take too many of those to start causing a problem. 

Up until now I'd query and delete via the developer console, but a CLI command is a little more efficient. This command also takes a -a flag to delete all logs in the org, rather than just those for my user.

Upgrading


Regardless of which plug-in you need to upgrade, you run the same command:

sfdx plugins:update

this checks for newer versions of all of your installed plug-ins and, if it finds any, installs them.

Related Posts


Wednesday, 10 June 2020

Generating PDFs with a Salesforce CLI Plug-In


Introduction


Yeah, I know, another week another plug-in. Unfortunately this is likely to continue for some time, as my  plug-ins are only really limited by my imagination. I think this one is pretty cool though and I hope, dear reader, you agree.

At Dreamforce 2019, Salesforce debuted Evergreen - a technology to allow Heroku microservices to be invoked from Apex (and other places) seamlessly. One of the Evergreen use cases is creating a PDF from Salesforce data, and one of the strap lines around this is that with Evergreen you have access to the entire Node package ecosystem. Every time I heard this I'd think that's true, but CLI plug-ins have the same access, as they are built on node, and like Evergreen there is no additional authentication required.

Essentially this is the opposite of Evergreen - rather than invoking something that lives on another server that returns a PDF file, I invoke a local command that writes a file to the local file system. I toyed with the idea of calling this plug-in Deciduous, but decided that was but of a lengthy name to type, and I'd have to explain it a lot! (and yes I know that Evergreen is a lot more than creating a PDF, but I liked the image so decided to go with it).

The plug-in is available on NPM - you can install it by executing : sfdx plugins:install bbpdf

EJS Templates


There are a couple of ways to create PDFs with node - using something like PDFKit to add the individual elements to the document, or my preferred route - generating the document from an HTML page. And if I'm generating HTML from Salesforce data or metadata, I'm going to be using EJS templates.

I'm not going to go into too much detail in this post about the creation of the HTML via EJS, but if you want more information check out my blog post on how I used it in my bbdoc plug-in to create HTML documents from Salesforce metadata.  

My plug-in requires two flags to specify the template. The name of the template itself, specified via the --template/-t flag, and the templates directory, specified via the --template-dir/-d flag. The reason I need the directory is that any css or images required by the template will be specified relative to the template's location. You can see this working by cloning the samples repo and trying it out.

Salesforce Data


My plug-in provides two mechanisms to retrieve data from Salesforce.

Query Parameter


This is for the simple use case where the template requires a single record. The query to retrieve the record is supplied via the --query/-q flag.

Querying Salesforce data from a plug-in is quite straightforward, I specify that I need a username which guarantees me access to an org:

protected static requiresUsername = true;

then I create a connection:

const conn = this.org.getConnection();

and finally I run the query, based on the supplied parameter,  and check the results:

const result = await conn.query<object>(this.flags.query);

if (!result.records || result.records.length <= 0) {
   ...
}

Once I have the record I need to pass in the Salesforce data in an object to the template, with the property name expected by the template, and this is provided by the user through the --sobject/-s flag.

This is a bit clunky though, so here's the preferred route.

Query File


A query file is specified via the --query-file/-f flag.  This is a JSON format file containing an object with a property per query:

{
    "contact": {
        "single": true,
        "query": "select Title, FirstName, LastName from Contact where id='00380000023TUDeAAO'"
    },
    "account": {
        "single": true,
        "query": "select id, Name from Account where id='0018000000eqTV7AAM'"
    }
}

The property name is the name that will be supplied to the EJS template - in this example there will be two properties passed to the template - contact and account.  The single property specifies whether the query will result in a single record or an array, and the query property specifies the actual SOQL query that will be executed. Using this mechanism, any number of records or arrays of records can be passed through to the template.

Generating the PDF


In a recurring theme in this post, there are a couple of ways to generate the PDF from the HTML. The simplest in terms of setup and code is to use the html-pdf package, which is a wrapper around PhantomJS. While simple, this is sub-optimal - the package hasn't been updated for a while, development on Phantom is suspended and when I added this to my plug-in, npm reported a critical vulnerability, so clearly another way would be required.

The favoured mechanism on the interwebs was to use Puppeteer (headless chromium node api), so I set about this. After some hoop jumping around creating temporary directories and copying the templates and associated files around, it wasn't actually too bad. I loaded the HTML from the file that I'd created and then asked for a PDF version of it:

const page = await browser.newPage();

await page.goto('file:///' + htmlFile, {waitUntil: 'networkidle0'});
const pdf = await page.pdf({ format: 'A4' });

One area I did go off-piste slightly was not using chromium bundled with puppeteer, instead I rely on the user defining an environment variable for their local installation of chrome and I use that. Mainly because I didn't want my plug-in to have to download 2-300 Mb before it could be used. This may cause problems down the line, so caveat emptor.

The environment variable in question is PUPPETEER_EXECUTABLE_PATH. Here are the definitions from my Macbook Pro running MacOS Catalina:

export PUPPETEER_EXECUTABLE_PATH="/Applications/Google Chrome.app/Contents/MacOS/Google Chrome"

and my Surface Pro running Windows 10:

setx PUPPETEER_EXECUTABLE_PATH "C:\Program Files (x86)\Google\Chrome\Application\chrome.exe"

The PDF is then written to the location specified by the --output/-o flag.

The next hoop to jump through came up when I installed the plug-in - Puppeteer is currently at 3.3.0 which requires Node 10.18.1 but the Salesforce CLI node version is 10.15.3. Luckily I was able to switch to Puppeteer version 2.1.1 without introducing any further issues.

Samples Repo


There's a lot of information in this post and a number of flags to wrap your head around - if you'd like to jump straight in with working examples, check out the samples repo. This has a couple of example commands to try out - just make sure you've set your chrome location correctly - and the PDFs that were generated when I ran the plug-in against my dev orgs.

Related Posts


Saturday, 30 May 2020

Documentor Plugin - Triggers (and Bootstrap)


Introduction

In previous posts about documenting my org with a Salesforce CLI plugin the focus has been on extracting and processing the object metadata. Now that area has been well and truly covered, it's time to move on. The next target in my sights is triggers - not for any particular reason, just that the real projects that I use this on have triggers that I want to show in my docs!

Trigger Metadata

Trigger metadata is split across two files - the .trigger file, which contains the actual Apex trigger code, and the .trigger-meta.xml file, which contains the supporting information - whether it is active, it's API version. The .trigger file itself contains the object that it is acting on and the action(s) that will cause it to fire:

trigger Book_ai on Book__c (before insert) {

}
Luckily the syntax is rigid - the object comes after the on keyword and the actions appear in brackets after that, so just using standard JavaScript string methods I can locate the boundaries and pull out the information that I want, but not just to display it.

Checking for Duplicates

As we all know, when there is more than one trigger for an object and action, the order they will fire in is not guaranteed. If you are a gambling aficionado then you may find this enjoyable, but most of us prefer a dull, predictable life when it comes to our business automation.

Once I've processed the trigger bodies and extracted the object names and actions, one of the really nice side-effects is that I can easily figure out if there are any duplicates and I can call these out on the triggers page (I've updated the sample metadata to add duplicate triggers - they don't actually do anything so wouldn't really be an issue anyway!) :

Bootstrap

Those that have been following this series of posts may notice that the styling looks a little better now than in earlier versions - this is because I've moved over to the Bootstrap library, pulled in via the CDN so I don't need to worry about including it in my plug-in. 

I've also updated the main page to use cards with badges to make it clear if there are any problems with the processed metadata :


Which I think we can all agree looks a lot better. You can see the latest version of the HTML generated from the sample metadata at https://bbdoc-example.herokuapp.com/index.html

I've also moved some duplicated markup out to an EJS include, which is as easy as I hoped it would be. The markup goes into a file with a .ejs suffix like any other - here's the footer from my pages:

<div class="pt-3"></div>
<footer class="footer">
    <div class="container">
        <div class="row justify-content-between">
            <div class="col-6">
                <p class="text-left"><small class="text-muted">Generated <%=footer.generatedDate%></small>
                </p>
            </div>
            <div class="col-6">
                <p class="text-right"><small class="text-muted">Bob Buzzard's Org Documentor
                        v<%=footer.version%></small></p>
            </div>
        </div>
    </div>
</footer>
And I can include this just by specifying the path:
<%- include ('../common/footer') %>
Note that I've put the footer in a common subdirectory that is a sibling of where the template is stored.
Note also that I've used the <%- tag which says to include the raw html output from the include. Finally, note that I don't pass anything to the footer - it has access to exactly the same properties as the page that includes it. 

As usual, I've tested the plug-in against the sample metadata repo on MacOS and Windows 10. You can find the latest version (3.3.1) on NPMJS at the link shown below.

Related Posts


Saturday, 23 May 2020

Going GUI over the Salesforce CLI Part 3

Introduction


In part 1 of this series I introduced my Salesforce CLI GUI with some basic commands.
In part 2 I covered some of the Electron specifics and added a couple of commands around listing and retrieving log files.
In this instalment I'll look at how a command is constructed - the configuration of the parameters and how these are specified by the user.

Command Configuration


As mentioned in part 1, the commands are configured via the app/shared/commands.js file. This defines the groupings and the commands that belong in those groupings, which are used to generate the tabs and tiles that allow the user to execute commands. For example, the debug commands added in the last update have the following configuration (detail reduced otherwise this post will be huge!) :

{
    name : 'debug',
    label: 'Debugging',
    commands : [
        {
            name: 'listlogs',
            label: 'List Logs',
            icon: 'file',
              ///////// detail removed //////////
        },
        {
            name: 'getlog',
            label: 'Get Log File',
            icon: 'file',
              ///////// detail removed //////////       
        }
    ]
}

which equates to a tab labelled Debugging and two command tiles - List Logs and Get Log File :


clicking on a command tile opens up a new window to allow the command to be defined, and here is where the rest of the configuration detail comes into play :


the screenshot above is from the List Logs command, which has the following configuration (in it's entirety) :

{
    name: 'listlogs',
    label: 'List Logs',
    icon: 'file',
    startMessage: 'Retrieving log file list',
    completeMessage: 'Log file list retrieved',
    command: 'sfdx',
    subcommand: 'force:apex:log:list',
    instructions: 'Choose the org that you wish to extract the log file details for and click the \'List\' button',
    executelabel: 'List',
    refreshConfig: false,
    refreshOrgs: false,
    json: true,
    type: 'brand',
    resultprocessor: 'loglist',
    polling: {
        supported: false
    },
    overview : 'Lists all the available log files for a specific org.',
    params : [
        {
            name : 'username',
            label: 'Username',
            type: 'org',
            default: false,
            variant: 'all',
            flag: '-u'
        }
    ]        
}

the attributes are used in the GUI as follows:

  • name - unique name for the command, used internally to generate ids and as a map key
  • label - the user friendly label displayed in the tile
  • icon - the SLDS icon displayed at the top left of the command page
  • startMessage - the message displayed in the log modal when the command starts
  • completeMessage - the message displayed in the log modal when the command successfully completes
  • command - the system command to be run to execute the command - all of the examples thus far use sfdx 
  • subcommand - the subcommand of the executable
  • instructions - the text displayed in the instructions panel below the header. This is specific to defining the command rather than providing help about the underlying sfdx command
  • executeLabel - the user friendly label on the button that executes the command
  • refreshConfig - should the cached configuration (default user, default dev hub user) be refreshed after running this command - this is set to true if the command changes configuration
  • refreshOrgs - should the cached organisations be updated after running this command - set to true if the command adds an org (create scratch org, login to org) or removes one (delete scratch org, logout of org)
  • json - does the command support JSON output
  • type - the type of styling to use on the command tile
  • resultProcessor - for commands that produce specific output that must be post-processed before displaying to the user, this defines the type of processor
  • polling - is there a mechanism for polling the status of the command while it is running
  • overview - text displayed in the overview panel of the help page for this command
  • params - the parameters supported by the command.

Parameters


In this case there is only one parameter, but it's a really important one - the username that will define which org to retrieve the list of logs from. This was a really important feature for me - I tend to work in multiple orgs on a daily (hourly!) basis, so I didn't want to have to keep running commands to switch between them. This parameter allows me to choose from my cached list of orgs to connect to, and has the following attributes:

  • name - unique name for the parameter
  • label  - the label for the input field that will capture the choice
  • type - the type of the parameter - in this case the username for the org connection
  • variant - which variant of orgs should be shown :
    •  hub - dev hubs only
    • scratch - scratch orgs only
    • all - all orgs
  • default - should the default username or devhubusername be selected by default
  • flag - the flag that will be passed to the sfdx command with the selected value

Constructing the Parameter Input


As I work across a large number of orgs, and typically a number of personas within those orgs, the username input is implemented as a datalist - a dropdown that I can also type in to reduce the available options - here's what happens if I limit to my logins :


as the page is constructed, the parameter is converted to an input by generating the datalist entry and then adding the scratch/hub org options as required:

const datalist=document.createElement('datalist');
datalist.id=param.name+'-list';

for (let org of orgs.nonScratchOrgs) {
    if ( (('hub'!=param.variant) || (org.isDevHub)) && ('scratch' != param.variant) ) {
        addOrgOption(datalist, org, false);
    }
}

if ('hub' != param.variant) {
    for (let org of orgs.scratchOrgs) {
         addOrgOption(datalist, org, true);
    }                    
}

formEles.contEle.appendChild(datalist);

The code that generates the option pulls the appropriate information from the cached org details to generate a label that will be useful:

let label;
if (org.alias) {
    label=org.alias + ' (' + org.username + ')';
}
else {
    label=org.username;
}

if (scratch) {
    label += ' [SCRATCH]';
}

and this feels like a reasonable place to end this post - in the next part I'll show how the command gets executed and the results processed.

Related Posts


Friday, 15 May 2020

Documenting from the metadata source with a Salesforce CLI Plug-In - Part 5


Introduction

In Part 1 of this series, I explained how to generate a plugin and clone the example command.
In Part 2 I covered finding and loading the package.json manifest and my custom configuration file.
In Part 3, I explained how to load and process source format metadata files.
In Part 4, I showed how to enrich fields by pulling in information stored outside of the field definition file.

In this week's exciting episode, I'll put it all together and generate the HTML output. This has been through several iterations :

  • When I first came up with the idea, I did what I usually do which is hardcode some very basic HTML in the source code, as at this point I'm rarely sure things are going to work.
  • Prior to my first presentation of the plug-in, I decided to move the HTML out to files that were easily changed, but still as fragments. This made showing the code easier, but meant I had to write a fair bit of boilerplate code, but was all I really had time for.
  • Once I'd done the first round of talks, I had the time to revisit and move over to a template framework, which was always going to be the correct solution. This was the major update to the plug-in I referred to in the last post.
Template Framework

I'd been using EJS in YASP (Yet Another Side Project) and liked how easy it was to integrate. EJS stands for Easy JavaScript templates, and it's well named. You embed plain old JavaScript into HTML markup and call a function passing the template and the data that needs to be processed by the JavaScript. If you've written Visualforce pages or email templates in the past, this pattern is very familiar (although you have to set up all of the data that you need prior to passing it to the generator function - it won't figure out what is needed based on what you've used like Visualforce will!).

A snippet from my HTML page that lists the groups of objects:

<% content.groups.forEach(function(group){ %>
    <tr>
        <td><%= group.title %></td>
        <td><a href="<%= group.link %>">Click to View</a></td>
    </tr>
<% }); %>

and as long as I pass the function that generates the HTML an object with a property of content, that matches the expected structure, I'm golden.

To use EJS in my plug-in, I install the node module,  :

npm install --save ejs

(Note that I'm using the --save option, as otherwise this won't be identified as a dependency and thus won't be added to the plug-in. Exactly what happened when I created the initial version and installed it on my Windows machine!)

I add the following line to my Typescript file to import the function that renders the HTML from the template:

import { renderFile } from 'ejs';

and I can then call renderFile(template, data) to asynchronously generate the HTML.

Preparing the Data

As Salesforce CLI plug-ins are written in Typescript by default, it's straightforward to keep track of the structure of your objects as you can strongly type them. Continuing with the example of my groups, the data for these is stored in an object with the following structure:

interface ObjectsContent {
    counter: number;
    groups: Array<ObjectGroupContent>;
    footer?: object;
}

Rather than pass this directly, I store this as the content of a more generic object that includes some standard information, like the plug-in version and the date the pages were generated:
let data={
             content: content,
             footer: 
             {
                 generatedDate : this.generatedDate,
                 version : this.config.version
             }
         };  

Rendering the HTML

Once I have the data in the format I need, I execute the rendering function passing the template filename - note that as this is asynchronous I have to return a promise to my calling function:

return new Promise((resolve, reject) => {
    renderFile(templateFile, data, (err, html) => {
        if (err) {
            reject(err);
        }
        else {
            resolve(html);
        }
    })
})  

and my calling function loops through the groups and gets the rendered HTML when the promise resolves, which it writes to the report directory:
this.generator.generateHTML(join('objects', 'objects.ejs'), this.content)
.then(html => {
    writeFileSync(this.indexFile, html);    
});

Moar Metadata

The latest version of the plugin generates HTML markup for an object's Validation Rules and Record types - the example repo of Salesforce metadata has been updated to include these and the newly generated HTML is available on Heroku at : https://bbdoc-example.herokuapp.com/index.html


Related Posts


Sunday, 26 April 2020

Documenting from the metadata source with a Salesforce CLI Plug-In - Part 4


Introduction


In Part 1 of this series, I explained how to generate a plugin and clone the example command.
In Part 2 I covered finding and loading the package.json manifest and my custom configuration file.
In Part 3, I explained how to load and process source format metadata files.

In this episode I'll show how to enrich the field information by pulling in information from elsewhere in the metadata - specifically global or standard value sets. When I'm using a global value set for picklist values, all I have in my field XML metadata is a reference to the set:

<valueset>
    <restricted>true</restricted>
    <valuesetname>Genre</valuesetname>
</valueset>

and the actual values live in the (in this case) Genre.globalValueSet-meta.xml file in the globalValueSets folder.

When I create the HTML report for the object metadata, I want to pull these values in, otherwise whoever is viewing the report has to go into the Salesforce org to figure out just which Genres are available.

Figuring the Value Set Type


Fields using standard value sets don't actually specify the value set name, instead it has to be derived from the field using the information in the metadata API documentation. I try to find a standard value set matching the field and if none exists then I fall back to loading the named global value set. The actual loading is the same, and should be familiar to anyone who read part 2 - I use fast-xml-parser to load the XML and parse - however, as multiple fields can refer to the same value set, I cache the parsed metadata :

let getGlobalValueSet = (dir, name) => {
    let valueSet=globalValueSetByName[name];
    if (null==valueSet) {
        globalValueSetByName[name] = valueSet = 
             parseXMLToJS(join(dir, 'globalValueSets', name + 
                                    '.globalValueSet-meta.xml'));
    }

    return valueSet;
}

I then assign this to a new property on the field named gvs. As I'm processing the metadata in an offline mode, if I can't find the global value set, the property will be null.

Adding the Information to the Field


When processing the field, I expand the values from the value set by iterating them and extracting the names - note that if the gvs property is not populated then I output a message that it isn't in version control:


var vsName=field.valueSet.valueSetName;
result+='<b>Global Value Set (' + vsName +')</b><br/>';
if (field.gvs) {
   field.gvs.GlobalValueSet.customValue.
      forEach(item => result+='&nbsp;&nbsp;' + item.fullName + '<br/>');
}
else {
   result+='Not version controlled';
}

This is a relatively simple piece of enrichment, just pulling some information from another XML metadata file and inserting that in the row for the field. However, it doesn't have to be metadata that is included - it can be additional information, a diagram, anything that can be written out to HTML - quite powerful once you realise that.


One More Thing


The version of the plugin is now at 2.0.3. From the user perspective nothing should change, but the mechanism for generating the report is completely different, which I'll write more about in the next exciting episode.


One More One More Thing


You can view the output for the example repo of Salesforce metadata on Heroku at : https://bbdoc-example.herokuapp.com/index.html

Related Posts