| Tweet |

Introduction
(Be honest, you knew this one was coming)
Example Flow
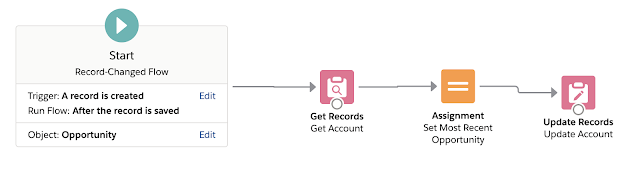
My example flow was once again refreshingly simple - when an opportunity is inserted, update a field on the associated account called Most Recent Opportunity with the ID of the new record - thus it had to be an after save flow as the record ID needed to be populated. For the purposes of the testing I also assumed the account lookup would always be populated on the opportunity.
As before, I turned the log level way down, ran my anonymous apex to insert one thousand opportunities spread across five accounts and then delete them, and checked the log file.
If what I was looking for was more confusion and perhaps controversy, I wasn't disappointed:

As this wasn't my first rodeo, I then put the insert/delete of the thousand records inside a loop and kept increasing the iterations - starting with 1, just in case that changed things.
- No loop (scenario above) - 0
- 1 x - 0
- 2 x - 6869
- 3 x - CPU limit exceeded - 19696
So unless we get a free thousand or so iterations, then the next thousand are expensive, and when the next thousand hugely expensive, I'd say the CPU logging is equally off for after save flows.
I then added a single line of apex to the end of the anonymously executed code:
Long newTime=Limits.getCPUTime();
This changed things quite dramatically:
- No loop - 6865
- 1 x - 7115
- 2 x - CPU time exceeded - 15779
Now this could be interpreted that getting the CPU time consumed to date via the Limits.getCPUTime method is incredibly expensive, but adding these inside the various loops I had to insert the data gave an increase of a couple of milliseconds, so that can be safely excluded.
Conclusion
Nothing I've seen in this latest experiment has changed my view that CPU is being consumed in flow automation, but it only gets tracked when the it is accessed. There is an additional wrinkle though, in that I do appear to be able to squeeze more work in if I don't cause the CPU to be tracked - I can successfully complete the two thousand inserts in this scenario, rather than breaching the CPU time quite spectacularly when I do track it.
This makes sense to me, as CPU isn't a hard limit - you can spike past it as long as the Salesforce infrastructure has capacity to handle it, so there is some checking around the CPU used and if this is awry the transaction will be allowed to proceed a little further than it otherwise might. It could also be coincidence, as the size of spikes allowed varies constantly, and I may be very close to succeeding in the cases where I breach, but I reran my tests a few times with much the same results.
Of course I don't really think I'm squeezing more work in, I'm taking advantage of what looks like a gap in the CPU tracking under certain circumstances. It would be a courageous decision (from Yes, Minister - a brave decision will cost you a few votes, a courageous decision will lose you the election!) to put something into production that relied on it - a single line of Apex added somewhere in the transaction would blow it out of the water, and I'm sure that at some point Salesforce will rectify this, and hopefully some of the others around CPU monitoring!
I'd also really love to see some of the logging that Salesforce captures internally - conjecture is good fun, but it would be nice to understand what is really happening.
Related Posts
No comments:
Post a Comment