Showing posts with label VS Code. Show all posts

Saturday, 1 August 2020

Visual Studio Codespaces - the tech behind Code Builder

Visual Studio Codespaces - the tech behind Code Builder


Salesforce launched Code Builder in June 2020, just before the 2020 TrailheaDX virtual conference, and it's fair to say there was some excitement around this. Those expecting a Developer Console Mk 2 must have been delighted to see a full-featured IDE that can run in the browser.  Even better, we confirmed with the product team that as the IDE is effectively running in a virtual machine, any required extensions and Salesforce CLI plug-ins can be installed, so you can recreate your local environment with all your favourite features.

I was certainly excited about this and reached out in a number of directions to try to get on the pilot, all of which sadly failed - I needed to be nominated by an Account Executive, and experience has taught me that at our number of licenses our AE typically doesn't even know that pilots are available, much less how to nominate me for one.

Undaunted, I took a different approach and started looking at the technology that powers Code Builder - Visual Studio Codespaces.  

Visual Studio Codespaces

Formerly known as Visual Studio Online, the description from official Microsoft site sums it up very well:

Cloud-hosted dev environments accessible from anywhere

There's some signup and setup required to start using Codespaces, as detailed below.

Sign up for Azure

A Microsoft account and Azure subscription are needed, as Azure hosts the virtual environments (machines). I chose the free subscription, which gives me 12 months free Linux virtual machine access. Compute hours are limited, but in all likelihood I'll use this rarely and then assuming it doesn't require me to spend a bunch of money, little or never once Code Builder is available.

VS Code Extensions

I then had to install a couple of extensions :
  • Azure Account, which gives VS Code access to my Azure subscription that I've just created. Signing in to this took ages, and was eventually tracked down to some kind of conflict with my Skype account that I was logged in to at the same time. The Skype account is linked to my Microsoft account in the same was as Azure is, but VS Code wasn't having it. In the end I logged out of Skype and I was able to login to Azure. Since then I've been able to login to Skype and Azure in any order, so it may have been a glitch with one of the connections at that point in time. If in doubt, sign out of everything!]
  • Visual Studio Codespaces, this allows VS Code to manage and connect to remote dev environments - you don't have to use the browser as a front-end with Codespaces and I can't see any reason you wouldn't be able to do this with Code Builder also, but time will tell.  
You also have to sign in to Codespaces, which you can do via the button on the left of VS Code:


Once you've signed in, choosing to create a new Codespace will take you through a process of creating a new plan - the key questions are the Azure region - make sure to choose one close to you, and the default instance type - I went for Linux.

Putting it Together

Once the accounts and extensions are in place, VS Code gains a new icon at the bottom left:


Clicking this opens the Codespaces menu: 


Choosing 'Create New Codespace' generates a new remote environment, after capturing some information from me. First, what type of environment I want - I've only used the Default settings and had no problems to date.


I then have a choice of creating an empty Codespace, or populating it with the contents of a repository - I'm using my Curated repo (currently private, but the contents of the repo aren't really important for this post - if you are curious what it is, it's my toolbox):


Then an easy question to answer - the Codespace name.


Once all the questions are answered, the extension gets to work on a new Codespace:


As well as the progress bar, a new panel opens on the right of VS Code to show the steps being completed (assuming all goes well - I've had one or two failures, but most of the time it's a breeze);


Once the setup is complete, clicking the Connect button opens the remote workspace through my local VS Code installation, which looks pretty much the same as a local workspace, bar a larger green element on the bottom left of the window:


and the fact that any changes I make here are not reflected in my local workspace unless I round trip them to the version control system. 

This is all well and good, and if I don't have a particularly powerful machine it's a nice way to be able to work on multiple projects at the same time and push a lot of the computing requirement to the cloud. The more interesting environment, however, is the browser.

Codespaces in the Browser

To access my Codespace from a browser, I have to login to the Visual Studio Codespaces web site at : https://online.visualstudio.com/login, using my Microsoft account that I attached my Azure subscription to. As an aside, I only seem to be able to login via a regular Chrome window, not an incognito one. I've no idea whether that is intentional, but it's been consistently the case since I started playing with Codespaces.

Once I've logged in I can see all of my current Codespaces, and I have the option to create more directly from the web site:


Clicking on my new CuratedBlog Codespace opens the IDE in the browser:


And as this is a virtual machine, the terminal works in the browser too!


That's all there is to it?

Not quite - while this gives me a Visual Studio Codespace primed with my Salesforce application metadata and running in the cloud, it doesn't know much about Salesforce, so I have to do a little more setup - note you can configure your Codespace environment via a devcontainer.json file in your project directory, so you wouldn't have to do this every time if you were spinning up multiple codespaces. I haven't looked at this in detail.


Once this is done, you now have the tools to interact with Salesforce orgs, but you still need to authenticate against them. This is the slightly long-winded part as, while it is technically possible to run a browser in a docker container, it doesn't look straightforward, so you'll likely end up using the JWT flow. This isn't particularly difficult, as long as you are familiar with the command line and open SSH commands, but it is a little long-winded as anyone who has set up a CI machine will testify, with the connected apps, keys and certs that you have to set up.

A similar problem presents itself once you have authenticated against your dev hub and created a scratch org - clicking the icon to open the org can't open a browser, so doesn't really do anything. The upside here is that it will typically tell you the URL that it is attempting to open which includes a session id, so you can copy/paste that into your local browser to access the scratch org, even though you haven't got any oauth for this org set up. The URL will appear in the Output tab:


This is where I expect Salesforce to add the Code Builder value - generating a Codespace that has the extensions and CLI pre-configured and already authorised against the org, as well as some other items that I haven't stumbled across yet.

Wrapping Up

While Codespaces require a bit of effort, until Code Builder is more widely available they are a really good way to be able to develop from any device that has a supported browser and internet connection.  In fact I was able to use Chrome on my iPhone XS to push changes to a scratch org. The UI was terrible so I wouldn't recommend it, but as an intellectual exercise it was fun.

Related Posts


Sunday, 14 April 2019

Push Source Faster with the Salesforce CLI and VS Code

Push Source Faster with the Salesforce CLI and VS Code

Introduction

When working with SalesforceDX scratch orgs and VS Code, deploying source is as simple as opening the command palette and choosing the correct command. If there are errors, these are captured in the problems view and I can simply click on the problem to open the file:

Not too arduous right? Actually, it can be, especially when I’ve been on a train or plane and done a bunch of offline work that I’m then trying to deploy. After about a thousand push, fix, repeat cycles, opening the menu and choosing an option seems slow.

Configuring the Default Build Task

Note: this isn’t the way you want to do it when pushing source to a scratch org - it is for the metadata API and it’s also a useful thing to understand. I’m trying to build some suspense really.

As I’ve written before, I can configure any shell command as the default build task in VS Code.

To set up source push as the default, I :

  • open up the command palette and choose ‘Tasks: Configure Default Build Task’
  • choose ‘Create tasks.json file from template'
  • choose ‘Other’

I then replace the contents of the tasks.json file with :

{
    "version": "2.0.0",
    "tasks": [
        {
            "label": "build",
            "command": "sfdx",
            "args": [
                "force:source:push"
            ],
            "group": {
                "kind": "build",
                "isDefault": true
            }
        }
    ]
}

and I can now run the push as the default build task using the key sequence SHIFT+COMMAND+B (on a Mac):

There’s one downside to this and it’s quite a biggie - the problems view is empty so I have to look at the command output to figure the problem and manually locate the problem file and line. Luckily I can solve this relatively easily (it requires regular expressions so obviously there’s a number of attempts to get this right) by adding a problem matcher to parse the output and find any errors:

{
    "version": "2.0.0",
    "tasks": [
        {
            "label": "build",
            "command": "sfdx",
            "args": [
                "force:source:push"
            ],
            "problemMatcher": [
                {
                    "owner": "KAB-apex",
                    "fileLocation": [
                        "relative",
                        "${workspaceFolder}"
                    ],
                    "pattern": {
                        "regexp": "^(.*)  (.*) \\((\\d+):(\\d+)\\)$",
                        "file": 1,
                        "line": 3,
                        "column": 4,
                        "message": 2
                    }
                },
                {
                    "owner": "KAB-lc",
                    "fileLocation": [
                        "relative",
                        "${workspaceFolder}"
                    ],
                    "pattern": {
                            "regexp": "^(.*) \\s \\w*:(\\w*:)(\\d+),(\\d+):\\s(.*)$",
                            "file": 1,
                            "line": 3,
                            "column": 4
                    }
                }
            ],
            "group": {
                "kind": "build",
                "isDefault": true
            }
        }
    ]
}

Now the problems view is populated again, so I have the same functionality with shortcut to kick the deployment off:

The Easy Way

Replacing the default build task is something that I’ve been doing on most of my projects to wire in a node script that manages deployments via the Metadata API. In that scenario I didn’t have any other options, but in this case it felt like I was having to recreate a lot of things to replace standard functionality. It felt like I should be able to create a shortcut to the entry in the command palette, but every time I googled I only got results around binding keyboard shortcuts to tasks.

A long time after I’d given up, I was looking to create a regular keyboard shortcut and opened the menu Code -> Preferences -> Keyboard Shortcuts and absent-mindedly typed ‘SFDX’ into the resulting screen, probably because it reminded me of the command palette:

The set of SFDX commands appeared! Scrolling down I found the source push command, and hovering over this showed a ‘+’ button that allowed me to define a shortcut key sequence - I choose SHIFT+OPTION+P:

Having configured this, I can now push the source simply by pressing that key combination, and I haven't had to replace any of the standard functionality:

As mentioned earlier, I’ve looked for a way to do this a number of times and had no luck - why that is the case I don’t know, but at least I got there in the end! As long as I don’t think about how much time I could have saved, it’s fine.

Related Posts


Saturday, 1 December 2018

Apex Snippets in VS Code

Apex Snippets in Visual Studio Code

Snippet

Introduction

As I’ve written about before, I switched over to using Microsoft Visual Studio Code as soon as I could figure out how to wire the Salesforce CLI into it for metadata deployment. I’m still happy with my decision, although I do wish that more features were also supported when working in the metadata API format rather than the new source format. When using an IDE with plugins for a specific technology, such as the Salesforce Extension Pack, it’s easy to focus on what the plugins provide and forget to look at the standard features. Easy for me anyway. 

Snippets

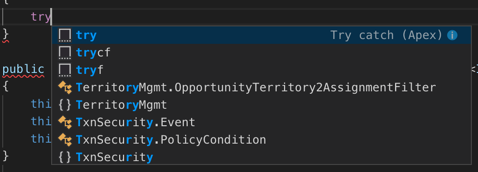
Per the docs, "Code snippets are small blocks of reusable code that can be inserted in a code file using a context menu command or a combination of hotkeys”. What this means in practice is that if I type in ‘try”, I’ll get offered the following snippets, which I can move between with the up and down arrow (cursor) keys:

Screenshot 2018 12 01 at 16 34 09

Note the information icon on the first entry - clicking this shows me the documentation for each snippet and what will be inserted if I choose the snippet. This is particularly important if I install an extension containing snippets from the marketplace that turns out to have been authored by my Evil Co-Worker - I can see exactly what nefarious code would be inserted before I continue:

Screenshot 2018 12 01 at 16 34 17

Which is pretty cool - with the amount of code i write, saving a few keystrokes here and there can really add up.

User Defined Snippets

The good news is that you aren’t limited to the snippets provided by the IDE or plugins - creating user defined snippets is, well a snip (come on, you knew I was going there).  On MacOS you access the Code ->Preferences -> User Snippets menu option:

Screenshot 2018 12 01 at 16 41 46

and choose the language - Apex in my case - and start creating your own snippet.

Example

Here’s an example from my apex snippets:

	"SObject_List": {
		"prefix": "List<",
		"body": [
			"List<${1:object}> ${2:soList}=new List<${1}>();"
		],
		"description":"List of sObjects"
	}

Breaking up the JSON:

  • The name of my snippet is “SObject_List”.
  • The prefix is “List<“ - this is the sequence of characters that will activate offering the snippet to the user.
  • The body of the snippet is "List<${1:object}> ${2:soList}=new List<${1}>();” 
    •  $1 and $2 are tabstops, which are cursor locations. When the user chooses the snippet, their cursor will initially be placed in $1 so they can enter a value, then they hit tab and move to $2 etc. 
    • $1.object is a tabstop with a placeholder - in this case the first tabstop will contain the value “object” for the user to change. 
    • If you use the same tabstop in several places, when the user updates the first instance this will change all other references
  • Description is the detail that will be displayed if the user has hit the information  icon.

The following video shows the snippet in use while creating an Apex class - note how I only type ‘Contact’ once, but both instances of ‘object’ get changed.

Nice eh? And all done via a configuration file.

Related Posts